Drawdown or Death?
Sooner or later a systematic strategy goes into a real losing run, and you have to answer one question: is it broken, or is it just the bad run the maths always promised?
- A drawdown inside your resampled 95th-percentile envelope is the strategy doing exactly what you sized it to survive.
- Depth alone tells you nothing. Watch trade frequency, average trade size, the in-sample/out-of-sample gap, and win rate versus average win: they move before the equity curve does.
- Only a structural change I can name, in the edge, the cost regime, or parameter stability, justifies a kill. A deep red month by itself is noise.
Get that wrong in one direction and you kill a good strategy at the bottom, right before it recovers. Get it wrong the other way and you keep feeding capital into an edge that died months ago. I've been on both sides of it. Here's how I decide now.
Mapping the Drawdown Envelope
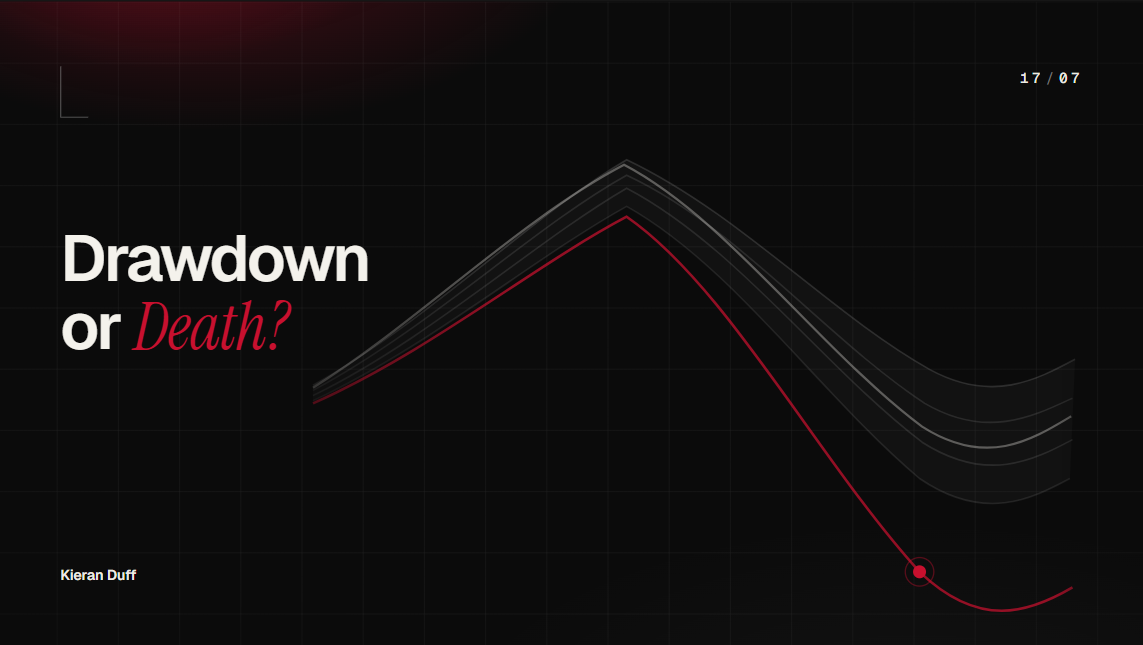
Before anything goes live, I already know what its bad runs look like. I resample the trade sequence a few thousand times and read the whole drawdown distribution: the full spread of depth and duration, which runs deeper and longer than the single historical worst. That gives me an envelope, a worst-case path I've sized to survive on both axes.
So when a strategy is underwater, the first question is boring: are we still inside that envelope? A 6% drawdown on something whose resampled 95th-percentile path is 9% over four months is the strategy doing exactly what I sized it to do. Sitting through that with full conviction is the skill (and it's a lot harder to hold when it's live money).
Has the shape changed, or only the number?
Depth on its own tells me almost nothing. What I watch for is the drawdown breaking its own character: trade frequency collapsing or spiking, the average trade drifting, the in-sample-to-out-of-sample gap that was stable in testing widening on live data, win rate holding while the average win shrinks (the fingerprint of costs eating an edge that used to clear them).
All of those move before the equity curve does. By the time the curve confirms a strategy is dead, you've already paid for the confirmation.
When I genuinely can't call it, I pull the live version and let it keep running on paper alongside. If paper keeps bleeding on the same logic with no execution drag involved, the edge is gone. If paper recovers while live lagged, the damage was cost or slippage. Fix the sizing and the execution before you touch the strategy itself.
The Structural Kill Switch
A structural change I can name: the behaviour it exploited stopped showing up, the cost regime moved under it, or the parameter stability I confirmed in testing fell apart on out-of-sample data I never optimised on. A deep month on its own has never been the reason.
On my own book, XAQP, the worst historical drawdown sits at -5.83% (as of July 2026). I don't treat that as a floor. It's one point on a distribution I've already sized to survive, and I check every live drawdown against that shape before I look at the depth.
Sitting in drawdown with full conviction is half the skill. Knowing the exact signals that would end that conviction is the other half.
Personal commentary, not advice. Past performance is not indicative of future results. Capital at risk.
Disclosure. Personal commentary, not financial advice. Capital at risk. I am an employee of Darwinex; content touching Darwinex products may represent a conflict of interest, disclosed per MAR Article 20.
XAQP figures are point-in-time as of July 2026 and will change.
Get the next letter in your inbox.
Please consider subscribing to receive more episodes of The Letter.
Subscribe now