Risk of Ruin
Why your backtest's maximum drawdown is a dangerous lie, and how to build a multi-strategy book that will survive the worst-case scenario.
- Your backtest's maximum drawdown is one ordering of your trades. Resample that sequence and the realistic worst case is usually far deeper than the number you have been quoting yourself.
- Size each sub-strategy so its own bad path costs the book something you can shrug at. I aim for a worst historical drawdown of around one percent of the book per strategy.
- Correlation is what actually ruins people. Strategies that look independent on a correlation matrix can pile into the same session and stack their losses on the same afternoon.
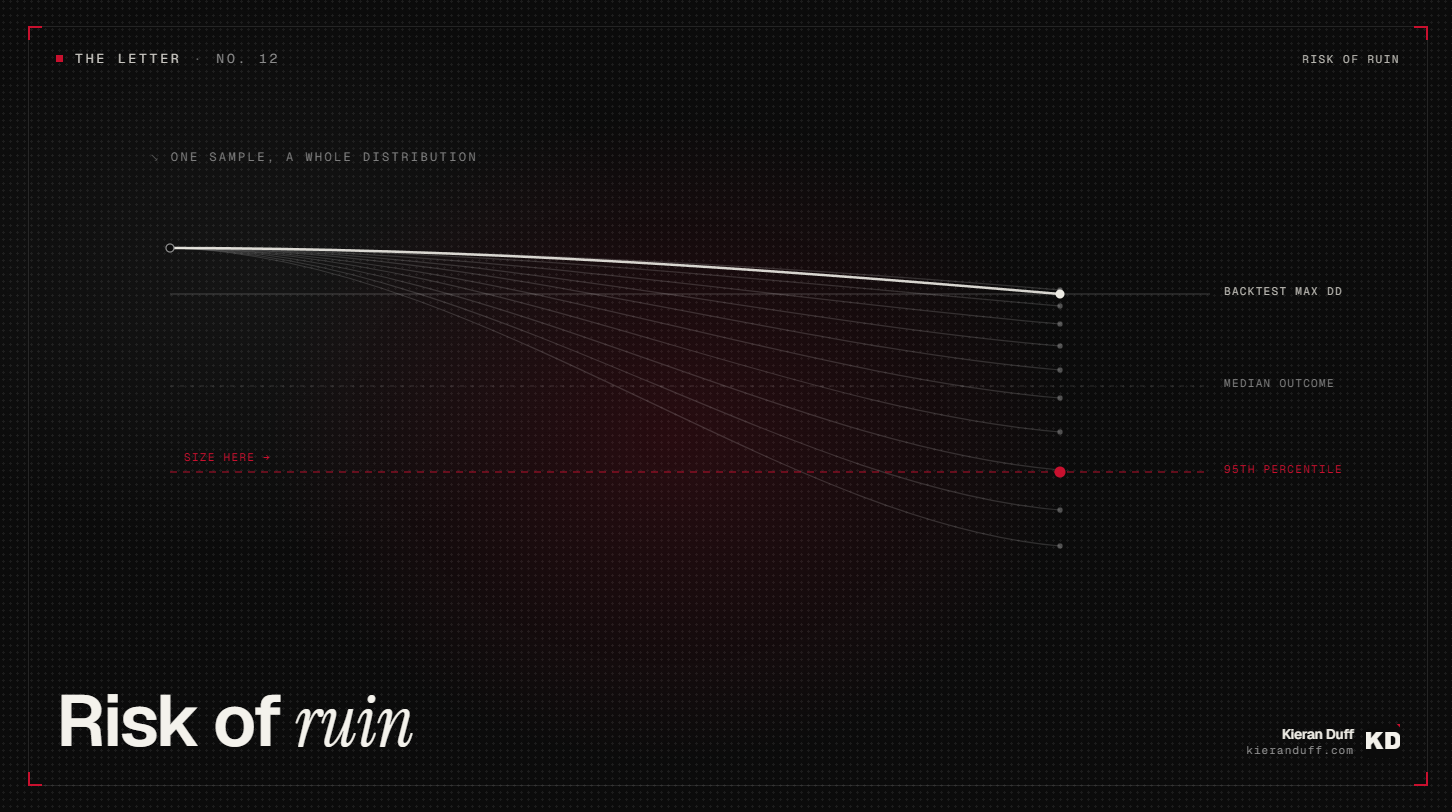
The worst drawdown your backtest ever produced is one number, and it is the number most books get sized against. It is one sample from a distribution, and usually the friendliest sample you will ever see. Risk of ruin comes down to one question: whether the size you chose can survive the drawdown you have not met yet.
This is how I size a multi-strategy book so the bad path, when it arrives, is survivable and boring rather than terminal.
What does risk of ruin actually mean for a retail book?
Risk of ruin is the probability that your equity falls far enough that you either cannot continue or will not continue. Those are two different failures and only one of them gets modelled.
The first is mathematical ruin. The account is gone, or small enough that the strategy can no longer be traded at a size that matters. This is the version the textbooks cover, and if you run sensible per-trade risk, it is not the one that gets you.
The second is behavioural ruin. The account is still alive. You are not. Somewhere in month four of a drawdown you decide the edge is gone, or you start overriding signals to feel like you are doing something, or you cut size at the bottom and miss the recovery the system was always going to deliver. None of that is the maths failing. It is you failing, while the account sits there intact.
A forty percent drawdown can be mathematically survivable and behaviourally fatal. That is what sizing is really for: choosing a size the worst version of you, in the worst month, can still leave alone. Growth-optimal maths is a separate conversation, and a less important one.
Why is your worst historical drawdown the wrong number to size against?
Because it is one sample, and you got lucky in a way you cannot see.
Think about what your backtest's maximum drawdown actually is. You have a list of trades. Those trades arrived in a particular order. The drawdown you recorded is the deepest trough produced by that specific ordering. Shuffle the same trades into a different sequence, with the same win rate, the same average win, the same average loss, and the drawdown changes, often dramatically. Cluster three of your biggest losers together and you get a trough far deeper than anything you've seen from your backtest.
Your realised maximum drawdown is the drawdown of the path you happened to walk. It is nowhere near the worst path available to a strategy with your statistics, most of the time.
So when a trader tells me their system's max drawdown is six percent and they have sized accordingly, what they have really done is size against their own good fortune. The market is under no obligation to deal the trades in the same order twice.
How do you get the real drawdown distribution?
Monte Carlo on the trade sequence itself. Resampling the price path is a different and much less useful test, so keep it on the trades.
The process is simple enough to run in an afternoon. Take the list of trade outcomes your strategy produced. Resample it, with replacement, a few thousand times. Rebuild the equity curve for each resampled sequence. Record the maximum drawdown of every run. What you get back is a distribution, and that distribution is the true picture of what your strategy can do to you.
Read the ninety-fifth percentile of that distribution. That is the number to size against. A strategy with a realised maximum drawdown of six percent will frequently show a ninety-fifth-percentile drawdown of twelve or fourteen. That gap is the risk you were already carrying and had not measured.
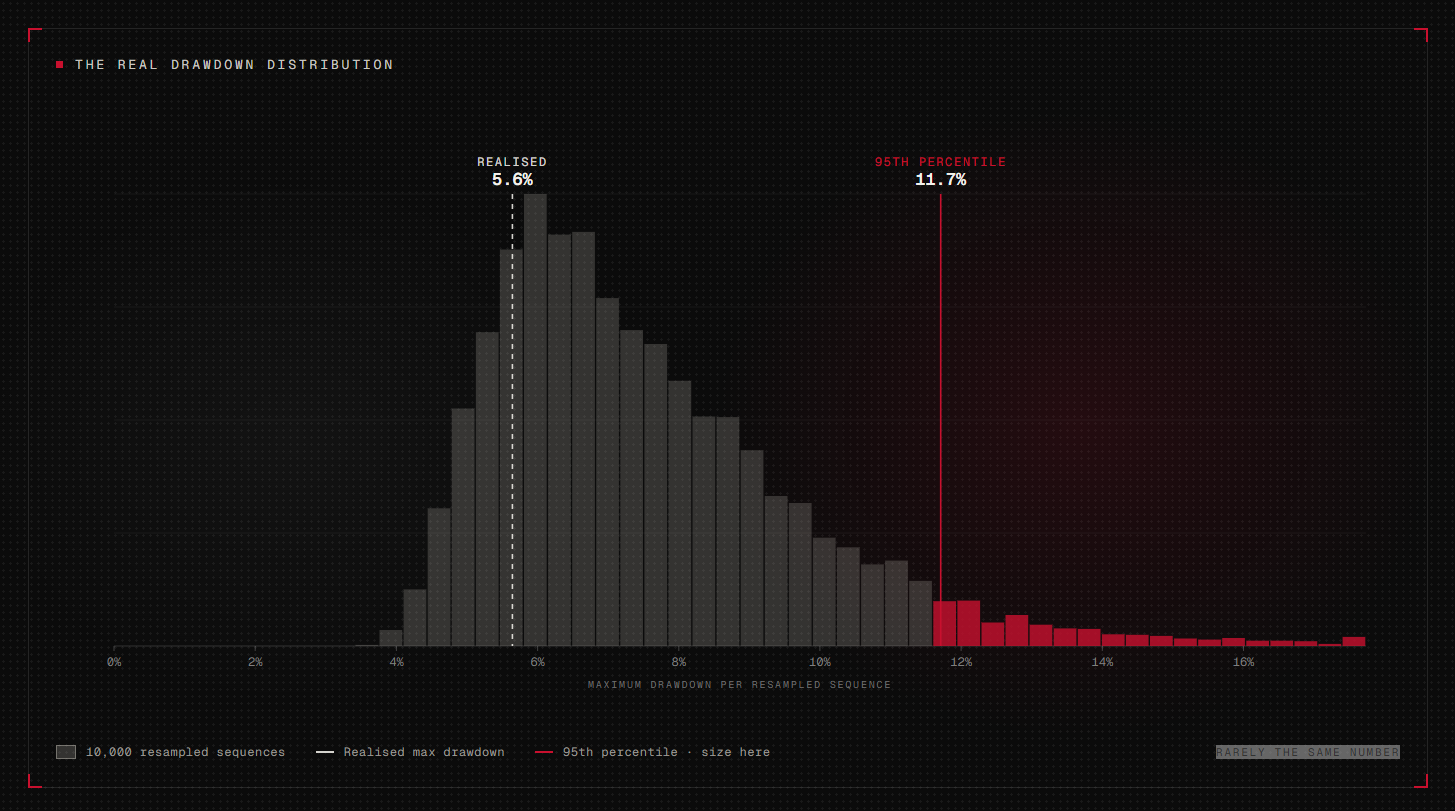
One caveat worth knowing, because this is where the numbers usually get flattered. A plain resample with replacement treats every trade as independent, which throws away any serial dependence in your sequence. If your losers cluster, and in trend and momentum systems they usually do, the true tail is fatter than the independent resample suggests. A block or stationary bootstrap keeps some of that clustering intact and typically pushes the ninety-fifth percentile further out. If your trade returns show meaningful autocorrelation, use one.
What does a per-strategy risk budget look like?
Once you have the distribution, sizing becomes a budgeting exercise.
I size each sub-strategy so that its worst historical drawdown lands at around one percent of the total book. My own master runs that scaled up by roughly 3.5 to 5 times at any given time, but one percent per strategy is the unit I build from. It sounds absurdly cautious written down. It stops sounding cautious the first time a strategy you had real confidence in starts falling apart, and you realise that retiring it costs you almost nothing, because it was never carrying the portfolio.
That is the whole point of the budget. The book is built to lose pieces. With twenty to thirty strategies running across FX, indices and metals, no single one is load-bearing, so no single one gets a vote on whether I stay in business. A strategy sized at fifteen percent of your risk budget will never be killed cleanly, because by the time it is clearly broken you are too deep in it to be objective.
Size small enough that killing is cheap, and killing stops being an emotional decision.
How does correlation blow up your sizing?
Every per-strategy budget rests on an assumption: that the bad days do not all arrive together. They do.
This is where most multi-strategy retail books are fragile, and it stays hidden until the day it matters. You check the correlation matrix, see a set of comfortable low numbers, and conclude the strategies are independent. But return correlation measured over months tells you very little about what happens in a single violent session. Strategies with entirely different logic can end up in the market at the same time, on the same instruments, in the same volatility spike, because they are all reacting to the same underlying condition.
The check that actually helps is trade overlap. Plot the distribution of how many strategies are simultaneously holding positions. Look at the right tail. That tail, not the average, is your real worst-day exposure, and it is usually a long way from the figure the portfolio equity curve reports.
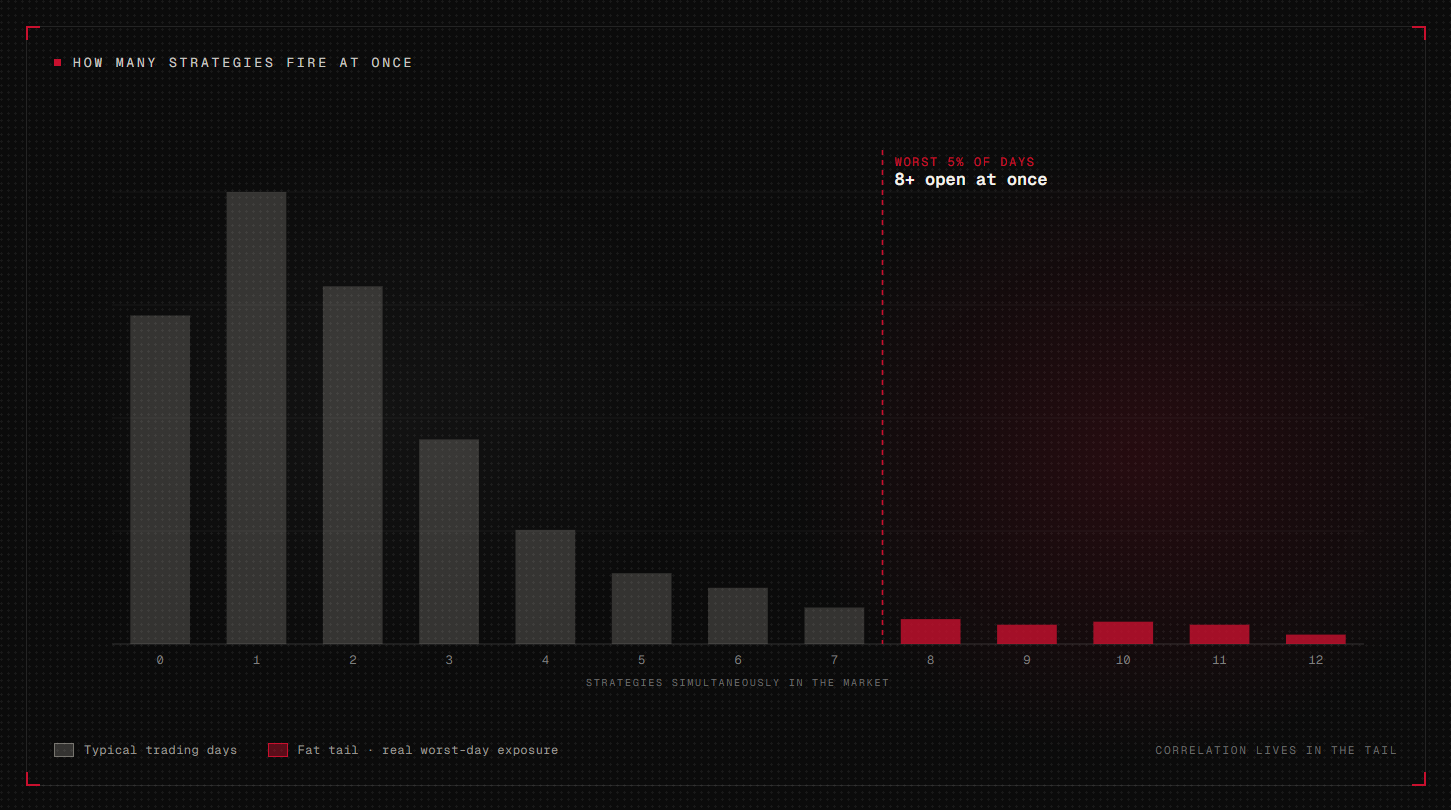
The fix is a ceiling. Cap the number of strategies allowed in the market at once, or cap total simultaneous open risk as a percentage of the book. A crude ceiling smooths the worst days more effectively than any amount of clever per-strategy tuning, because the worst day is a crowd of systems going down together in the same hour, all of them leaning on the same condition.
Fixed fractional or volatility targeting?
Both work. The mistake is drifting into one without deciding.
Fixed fractional risks the same fraction of equity per trade. It is simple, transparent, and it scales your position down automatically as the account shrinks, which is a genuinely useful property in a drawdown. Its weakness is that a fixed percentage of equity means a wildly varying amount of risk in volatility terms. The same one percent risk buys you a very different exposure in a calm market than in a violent one.
Volatility targeting sizes to recent realised volatility, so your risk stays roughly constant in vol terms. It is the more sophisticated default, and it has a trap built into it. You size off volatility that has already happened, which means your size always reflects the regime that just ended. When volatility jumps, you take the first leg of the shock at a size calibrated to the calm that preceded it, and the lookback catches up afterwards, when the damage is done.
The length of that lookback is a live risk decision with real money attached. Shorten it to react faster and you pay in noise, sizing up and down on every twitch. Lengthen it and you react too slowly to the move that matters. Whichever you pick, test it like the risk parameter it is, rather than leaving it on the platform default.
How do you know your sizing is right?
Run the ninety-fifth-percentile path and ask yourself an honest question: could you sit through that, in public, without touching the system?
If the answer is no, you are too big. It does not matter what the growth-optimal maths says.
There is a second test that people skip. After that worst path, is there enough capital left to keep trading the same strategies at a size that can recover? A book that survives a drawdown but comes out the other side too small to earn its way back has been ruined in every way that matters except the technical one. Recovery arithmetic is brutal and unforgiving: the deeper the hole, the more the survivors have to carry.
So the sizing question is bigger than whether you would still have an account. It is whether you would still have a business.
Common questions
What is a safe risk per trade for a systematic trader?
There is no universal number, because it depends on your edge, your trade frequency and how correlated your strategies really are. Work backwards instead. Decide the drawdown you could genuinely sit through without interfering, find the ninety-fifth-percentile drawdown path of your book, and set per-trade risk so that path lands inside your tolerance.
Should I size against max drawdown or standard deviation?
Against the drawdown distribution. Standard deviation describes the typical wobble, and ruin does not happen in the typical case. Resample the trade sequence, take the ninety-fifth-percentile maximum drawdown, and size to that.
Does diversification reduce risk of ruin?
Only if the diversification is real. Strategies with low return correlation can still hold positions at the same time in the same sessions, so their losses land on the same days. Check trade overlap before you trust the correlation matrix.
How many strategies do you need before per-strategy sizing works?
Enough that no single one is load-bearing. If one strategy breaking would force you to change how you run everything else, it is too big, whether you have three strategies or thirty.
Is risk of ruin the same as blowing up the account?
No. Mathematical ruin is the account being gone. Behavioural ruin is you quitting, or overriding the system, while the account is still perfectly alive. The second happens far more often, and it is the one that almost never gets sized for.
Sizing is the decision that survives you being wrong
Everything else in a systematic book is a bet on being right. The entry logic, the filters, the regime detection, all of it is an attempt to be correct more often or more profitably than the market expects. Sizing is different. Sizing is the only decision that assumes you are going to be wrong, repeatedly, in ways you did not model, and asks what happens to you when that occurs.
Get it wrong in the optimistic direction and no amount of edge saves you, because you will not be there for the recovery. Get it right and a bad year becomes an uncomfortable year, which is a distinction that decides careers.
Size for the path you have not walked yet.
Personal commentary, not advice. Capital at risk.
Disclosure. I work for Darwinex (FCA-regulated). This is my personal commentary, not advice. Capital at risk. I am an employee of Darwinex; content touching Darwinex products may represent a conflict of interest, disclosed per MAR Article 20.
XAQP figures are point-in-time as of July 2026 and will change.
Get the next letter in your inbox.
Please consider subscribing to receive more episodes of The Letter.
Subscribe now