Strategy Decay: Is it Dead?
How to tell a dying edge from ordinary bad luck, using signal-health numbers that move, because usually the equity curve is the last place strategy decay shows up.
- Decide what normal underperformance looks like before you go live, using a Monte Carlo envelope of your own trade sequence. Without that band, you cannot tell a bad run from a dead edge.
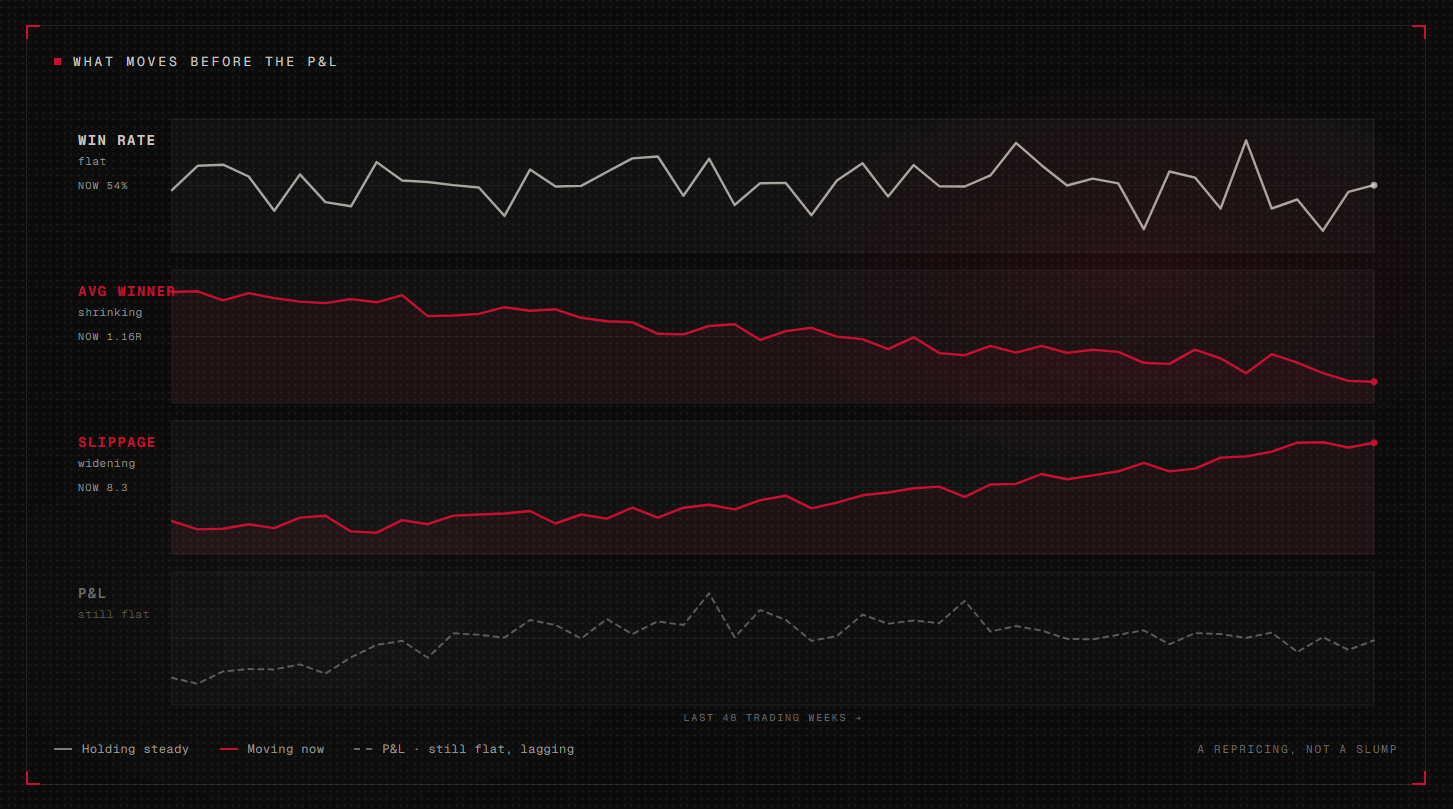
- Several numbers move before the P&L does: how live is tracking against the backtest, how the edge is shaped (the average winner as much as the hit rate), and how fills compare to what you modelled.
- The deciding question is structural: is the market behaviour your strategy was built to capture still happening?
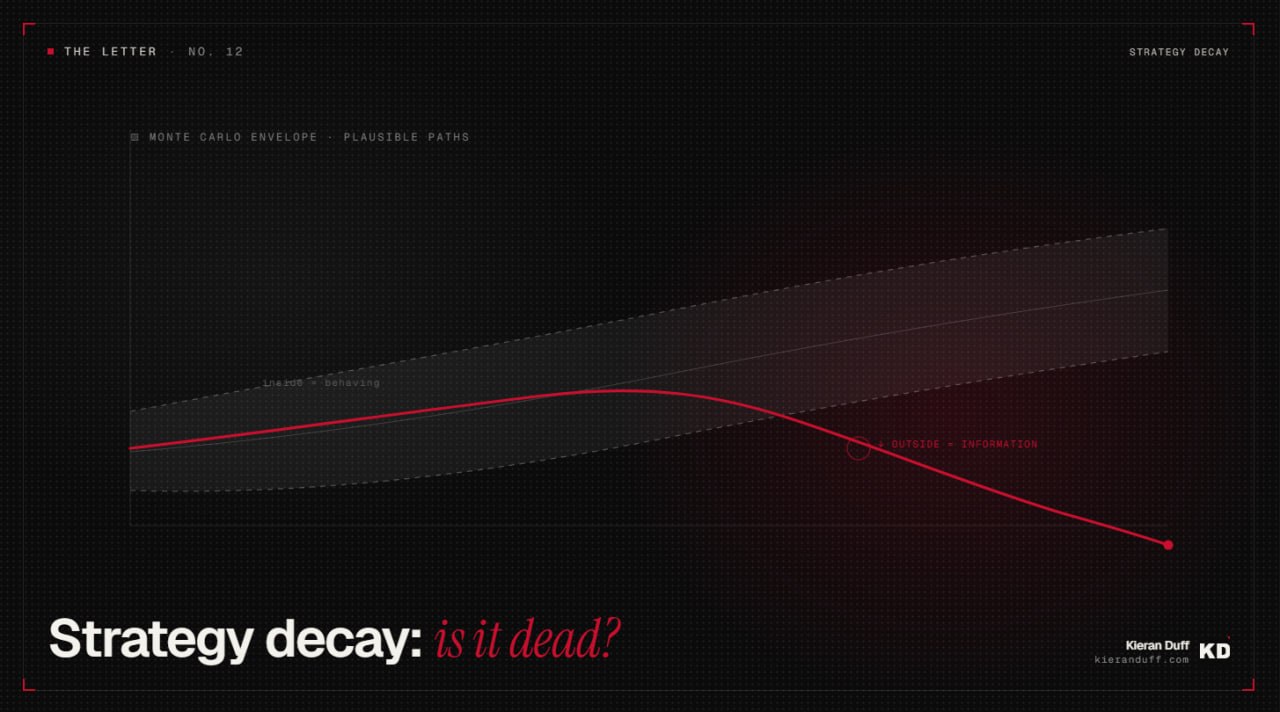
By the time your equity curve tells you a strategy is dead, the account is likely already past recovery. The curve is where decay shows up last, as an afterthought of kind. That is the problem with running a live book off its P&L: you wait for the money to confirm what a handful of other numbers were already saying months ago.
Every systematic trader eventually sits in front of a strategy that is underperforming and has to answer one question honestly: is this thing broken, or am I just unlucky? Here is how I answer it.
Why can the equity curve not tell you?
Simply because the equity curve is a lagging indicator of your own edge, yet it is the one variable you cannot stop looking at.
Strategy decay is not an event. It does not arrive on a specific day. It looks like a normal drawdown, then it looks like a slightly long drawdown, then it looks like a drawdown that is taking an oddly long time to recover. Each individual week is perfectly consistent with variance, which is exactly why the curve is such a poor alarm. By the time the shape of the equity curve is unambiguous, you have usually given back twelve to eighteen months of returns finding out.
The curve also has an unhelpful property: it is the number with your money attached, so it commands attention it has not earned as a diagnostic. You can stare at a P&L line for hours and never once open the trade log that would actually tell you something.
What does normal variance actually look like?
This is the question to settle in advance, and leaving it unanswered is how healthy strategies end up retired for no reason.
A strategy with a genuine edge will still produce losing months, long flat stretches, and runs of consecutive losers that feel pathological while you are inside them. The question is whether what you are experiencing is inside the range your strategy could plausibly produce. And you can know that range, precisely, before a penny is at risk.
Take your backtest trade sequence. Resample it a few thousand times. Rebuild the equity path for each run. Now look at what those paths do over a hundred trades, over two hundred, over a year. You get an envelope: the range of outcomes a strategy with your statistics can plausibly deliver, including the ugly ones. Write down the boundary.
Live inside that envelope is behaving, however grim it feels on the screen. Live outside it, repeatedly and in the same direction, is information. That single distinction, decided while you are calm, is the difference between a diagnostic and a mood.
The panic almost always comes well inside the strategy's own historical worst streak. The streak was there in the numbers the whole time. It just never got looked at.
Which numbers move before the P&L does?
Three, in my experience, and none of them is the return.
Live-versus-backtest variance. This is the envelope above, tracked continuously. When live drifts outside the band, particularly in the same direction over successive windows, that is a signal weeks or months before the drawdown looks alarming.
How the edge is shaped. This one is subtle and it is the one that catches good strategies. Watch the average trade in R alongside the win rate. A win rate that holds steady while the average winner shrinks is a strategy being repriced under metrics that still look fine. The headline P&L can look fine for a long time, because the hit rate is unchanged, right up until the point where the tail trades that paid for everything stop happening. The edge is not disappearing evenly. It is being hollowed out from the top.
Fill quality against what you modelled. If slippage is creeping wider and fills are landing later than the backtest assumed, the edge is being eaten by execution even though the logic is completely intact. This is a different disease with a different cure, and it is easy to misdiagnose as decay when it is really a broker or a capacity problem.
None of these is the P&L. All of them lead it.
How do you separate decay from bad luck?
When the numbers above start flashing, you have a statistical signal that something is off. What you do not yet have is a cause. That requires a different kind of question, and it is not a statistical one.
Go back to why the edge should exist at all.
Every strategy is a bet on a specific market behaviour. Price tends to continue after a volatility expansion. This pair reverts within a session. This instrument systematically overreacts to a particular kind of news. Whatever it is, you had a reason, or you should have. Write it down and ask, plainly: is that behaviour still happening?
You can usually test this directly, and separately from your P&L. Measure the underlying behaviour in the raw data over the recent period, without your strategy's rules in the way. If the behaviour is still there and your strategy is still underperforming, you likely have an execution or a cost problem, or you are inside a variance run that will resolve. If the behaviour has genuinely stopped occurring, no amount of parameter tuning will bring it back. You are not unlucky. You are late.
This is why re-optimising a struggling strategy is usually the wrong first move. It refits the parameters to the noise of the bad period, buys you a few comfortable weeks, and then breaks again, having taught you nothing. Fix the understanding before you touch the parameters.
What does a decaying edge actually look like?
Decay tends to arrive through one of four doors, and it helps to know which one you are looking at.
Crowding. The behaviour is still there, but so are a lot of other people, and the move you used to capture is now more expensive to get. This shows up as a shrinking average winner rather than a falling win rate, and as worsening fills, because you are competing for the same liquidity.
Regime shift. The statistical relationship your edge leaned on has changed. A volatility level, a correlation between two instruments, a mean-reversion speed. The strategy still works; its season has just ended. The question is whether that season comes back.
Cost drift. Nothing about the market has changed. Your spreads widened, your broker's execution got worse, or you scaled up and started paying more to get in. The edge is intact on paper and gone in practice.
Capacity. You grew. The size that used to slip in unnoticed now moves the price against you, and the strategy is capped below the size you are trying to run it at.
Three of those four are fixable without abandoning the idea. Knowing which one you have is most of the job.
What do you do with each answer?
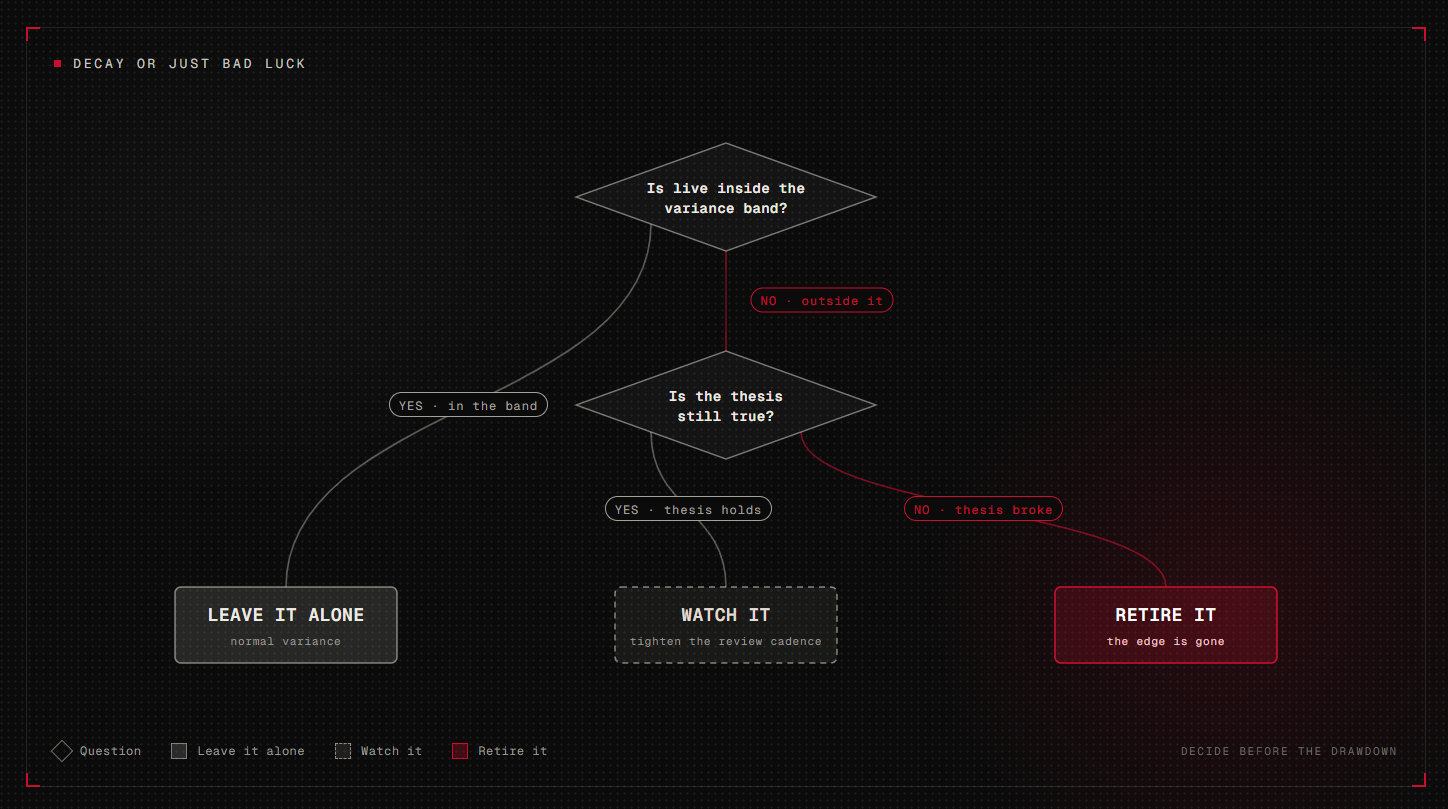
If live is inside the envelope and the thesis holds, you do nothing. This is the hardest instruction in systematic trading and the most valuable. The drawdown is the strategy doing what it was always statistically capable of doing, and interfering now is how you convert a normal bad run into a permanent loss.
If live is outside the envelope but the thesis holds, you investigate the plumbing before you touch the logic. Costs, fills, data, execution. More strategies are killed for a broker problem than you would think.
If the thesis has stopped being true, you retire it, fully, off the book. A pause leaves the door open for the override that destroys systematic discipline, and a strategy you are sentimental about will find its way back in.
Why does killing early cost less than nursing?
Because of how you sized it, or rather, because of how you should have.
When every sub-strategy is sized so its own worst drawdown costs the book something you can shrug at, retiring one is close to free. There is no agonising, no hoping, no giving it one more month, because there is nothing riding on it that threatens the whole. The book was built to lose pieces.
Conviction keeps a correct position alive through a drawdown. The same conviction keeps a dead strategy on the book.
That is really an argument about sizing as much as decay, and the two are inseparable. A strategy that represents a large slice of your risk budget can never be killed cleanly, because by the time it is obviously broken you are too deep in it to be objective. Conviction is worth a great deal when a position is drawing down and still correct. Once the strategy underneath it has stopped being the one you tested, that same conviction is what keeps a dead strategy on the book.
Telling those two apart, honestly, is most of the job of running systematic money.
Common questions
How long should I give a losing strategy before I retire it?
Decide before you go live, and measure it in trades rather than calendar days, because calendar time punishes a strategy for sitting quiet when it has no valid signals. A pre-defined recovery threshold, drawn from the backtest's own recovery distribution, takes the decision away from you at the exact moment you are least equipped to make it.
Can a strategy recover after it stops working?
Sometimes, if the edge was regime-dependent and the regime returns. Betting on that is a discretionary call. If the behaviour your strategy captures has genuinely stopped occurring, waiting is just throwing money into a fire.
How many losing trades in a row is normal?
Whatever your own resampled trade sequence says is normal. Run a few thousand paths and look at the longest losing runs across them. The answer is almost always longer than you would guess, which is why the urge to quit tends to hit inside your own historical worst streak.
Should I re-optimise a strategy that is underperforming?
Usually not, and certainly not first. Re-optimising during a drawdown fits your parameters to the noise of the bad period. Re-derive the thesis, check whether the market behaviour is still there, and only then consider the parameters.
What is the difference between strategy decay and overfitting?
Overfitting means the edge was never real and live simply revealed the truth. Decay means the edge was real and the market has since changed. The live symptoms look almost identical, which is precisely why you need the variance band defined in advance to tell them apart.
The curve is a lagging indicator of your own edge
The traders who survive decay are the ones who decided, in advance and while calm, what normal looked like, and who wired up the numbers that move before the money does.
Everything after that is discipline. You watch the leading indicators, you interrogate the thesis, and when the answer comes back that the behaviour has gone, you take the strategy off the book without ceremony and without a story about how it might come back.
Personal commentary, not advice. Capital at risk.
Disclosure. I work for Darwinex (FCA-regulated). This is my personal commentary, not advice. Capital at risk. I am an employee of Darwinex; content touching Darwinex products may represent a conflict of interest, disclosed per MAR Article 20.
XAQP figures are point-in-time as of July 2026 and will change.
Get the next letter in your inbox.
Please consider subscribing to receive more episodes of The Letter.
Subscribe now