It's Overfit
How to tell whether your strategy is robust before live trading.
- Overfitting hides in three places: in-sample optimisation, parameter sensitivity, and trade-order luck. Each needs its own check.
- The three checks are walk-forward analysis, parameter sensitivity heatmaps, and Monte Carlo on the trade sequence. Run them in that order.
- The test is live-vs-backtest variance after the first 100 trades. If the live equity curve drifts more than 15 to 20 percent from the backtest's expected path, the strategy was overfit.
Most systematic strategies are overfit. The traders who run them do not know it until live trading exposes it. By then the capital has already been allocated and the drawdown is real. The way to avoid overfitting in trading strategies is to run multiple specific checks before any model touches a live account, in a specific order, and read the output whilst being brutally honest with yourself.
This piece walks through the workflow I run on every candidate strategy that goes into XAQP. None of it is exotic. All of it is achievable in any decent build environment, including StrategyQuantX, MetaTrader 5 with custom EAs, or a handwritten Python loop.
We will cover some of the checks you can put in place to catch overfitting, but there are more checks beyond these three and there is never a 100% guarantee you will avoid it. Worth setting that expectation upfront.
What does overfitting actually look like in practice?
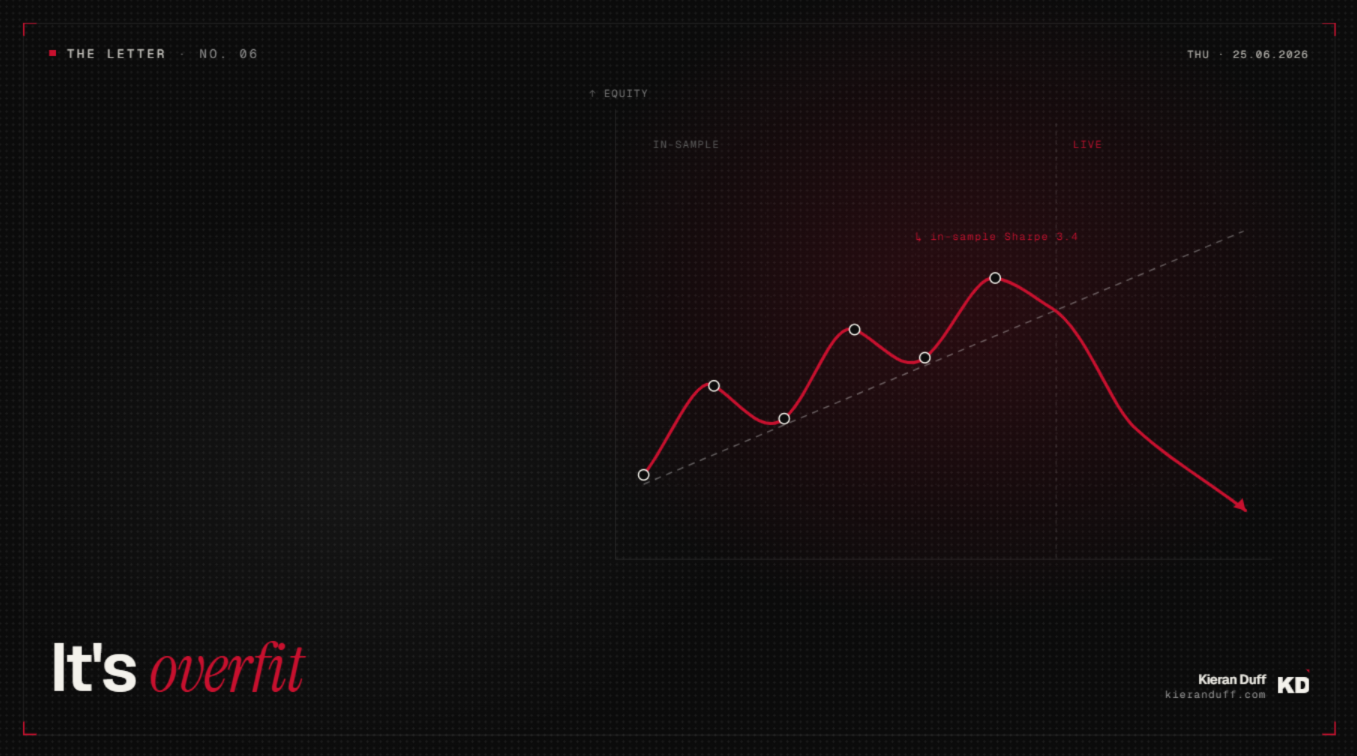
Overfitting is a model that performs brilliantly on the data it was built with and falls apart on data it has not seen. In a backtest, it shows up as an unusually smooth equity curve, an in-sample Sharpe ratio that's ridiculously above expectation, a maximum drawdown that seems too clean for the asset class, and a parameter set with values that look surgically selected (who on earth uses a 72 period moving average, ask yourself that).
The model has memorised the past.
An example: I see a candidate strategy on EUR/USD with an entry rule keyed to a 20-period moving average. The backtest looks excellent across five years of data. I shift the lookback to 21 periods. The equity curve drops 30 percent. I shift to 19. Same collapse. The strategy was measuring a historical accident. The lookback had been tuned to fit a specific pattern the surrounding values do not support.
The hard part is that overfitting often does not come to you and announce itself, it hides in dark places and your job is to hunt for it. A model with a Sharpe of 1.8, a 12 percent max drawdown, and 800 trades across multiple regimes can still be overfit. The surface metrics look reasonable. The decay shows up six months into live trading when the regime shifts and the strategy stops working.
Why do most robustness checks fail?
Platforms offer Monte Carlo, walk-forward, and parameter sweeps as menu items. Most managers click them, see green ticks, and ship. The problem is that each check is being run in a way that confirms what the trader already wants to believe (bias).
Three failure modes come up repeatedly.
The walk-forward window is too short. A six-month optimisation followed by a one-month out-of-sample test catches almost nothing because the regime barely changes across that window. The walk-forward needs to span enough market history to capture at least two regime shifts. For FX majors, indices, and metals, that means a minimum of three years of data, with monthly refits and at least 18 months of cumulative out-of-sample windows.
The parameter sensitivity sweep was tuned to pass. Traders run a sweep, find the parameter combination with the highest backtest return, and report that as the strategy. The sweep should test every parameter at plus or minus one or two standard deviations around the chosen value. If the equity curve survives a ten percent perturbation in every parameter, you most likely have something. If a one-tick change to a single value drops returns by 30 percent, you do not.
Monte Carlo is being run on the wrong axis. Some platforms randomise price paths instead of trade sequences. That tests model fragility to data noise, which matters less than it sounds. The check that catches overfitting is trade-order randomisation: take your actual list of historical trades, shuffle them ten thousand times, and look at the distribution of equity curves and drawdowns. If the median outcome is materially worse than the original sequence, your backtest was lucky.
These are three of the failure modes the workflow below is designed to defeat.
Check 1: Walk-forward analysis (the floor, not the ceiling)
Walk-forward analysis is the minimum bar for any systematic backtest. It does not prove a strategy works. It proves the strategy did not get to see the future during optimisation.
The mechanics: split your historical data into sequential windows. Optimise the strategy parameters on the first window (in-sample). Test the unchanged parameters on the next window (out-of-sample). Re-optimise on a sliding window. Repeat across the full dataset. The result is a chain of out-of-sample equity curves that, stitched together, simulate what the strategy would have done if it had been live and re-tuned periodically.
The settings that matter:
Window length. Optimisation windows of less than 12 months are too short for FX, indices, and metals. The regime does not move enough. I default to 18 months in-sample, 6 months out-of-sample, sliding monthly. For higher-frequency strategies this can compress.
Walk-forward efficiency. This is the ratio of out-of-sample annualised return to in-sample annualised return. A passing strategy delivers walk-forward efficiency above 50 percent. Below 50 percent means the in-sample optimisation is doing most of the heavy lifting, which is the textbook signature of overfitting.
I also run an old out-of-sample test using data from before the in-sample window. This catches strategies that look fine on walk-forward but rely on a specific market structure that did not exist five years earlier. If a strategy works on 2024 forward but breaks on 2010-2018 data, the build period is the only regime it can survive.
Walk-forward is the entry test. Strategies that fail this never reach the next stage. Strategies that pass still need the other two checks.
Check 2: Parameter sensitivity heatmaps (the most under-used)
Parameter sensitivity is the single highest-value check in the toolkit. The version that works is the heatmap: for each pair of parameters, plot the equity curve metric (Sharpe, return, or drawdown) across a grid of nearby values and look at the shape of the surface.
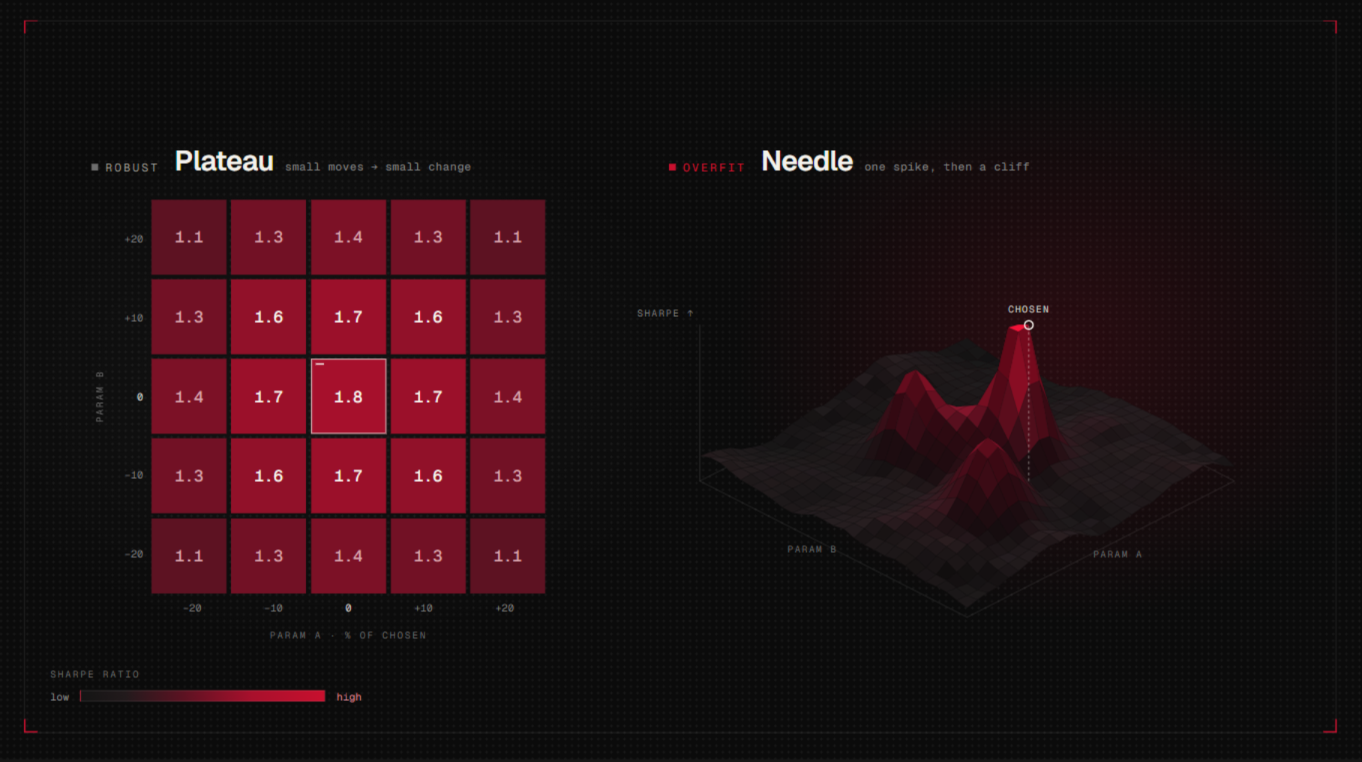
A strategy that holds up has a parameter surface that looks like a flat plateau or a gentle hill. Small changes to the parameters produce small changes in the equity curve. The chosen parameters sit in the middle of a stable region.
An overfit strategy has a parameter surface that looks like a needle. The chosen values sit on a narrow spike of high performance surrounded by a cliff. Shift any parameter slightly and the strategy collapses. The optimiser has found a historical accident.
The practical workflow:
For each parameter, test the chosen value at minus 20 percent, minus 10 percent, the chosen value, plus 10 percent, plus 20 percent.
Compute the Sharpe ratio at each grid point.
Pass criterion: the Sharpe at all four perturbations stays within 70 percent of the original.
A strategy that passes parameter sensitivity has learned something durable about the market structure. The shape of the surface is the evidence.
This check is also the most useful for traders building with block builders like StrategyQuantX. The platform's genetic optimiser will find the highest backtest return by default. The trader's job is to throw away the genetic-optimisation winners that look like needles, even when the metrics look better than the plateau winners.
Check 3: Monte Carlo on the trade sequence
Walk-forward catches one type of overfitting. Parameter sensitivity catches another. The third type slips through both: trade-order luck.
A strategy with a Sharpe of 1.5, 600 trades, and a 10 percent drawdown looks solid. What those metrics hide is that the equity curve might depend heavily on the specific sequence in which those trades arrived. If the largest winners cluster early and the largest losers cluster late, the maximum drawdown understates the real risk because the early gains created a buffer.
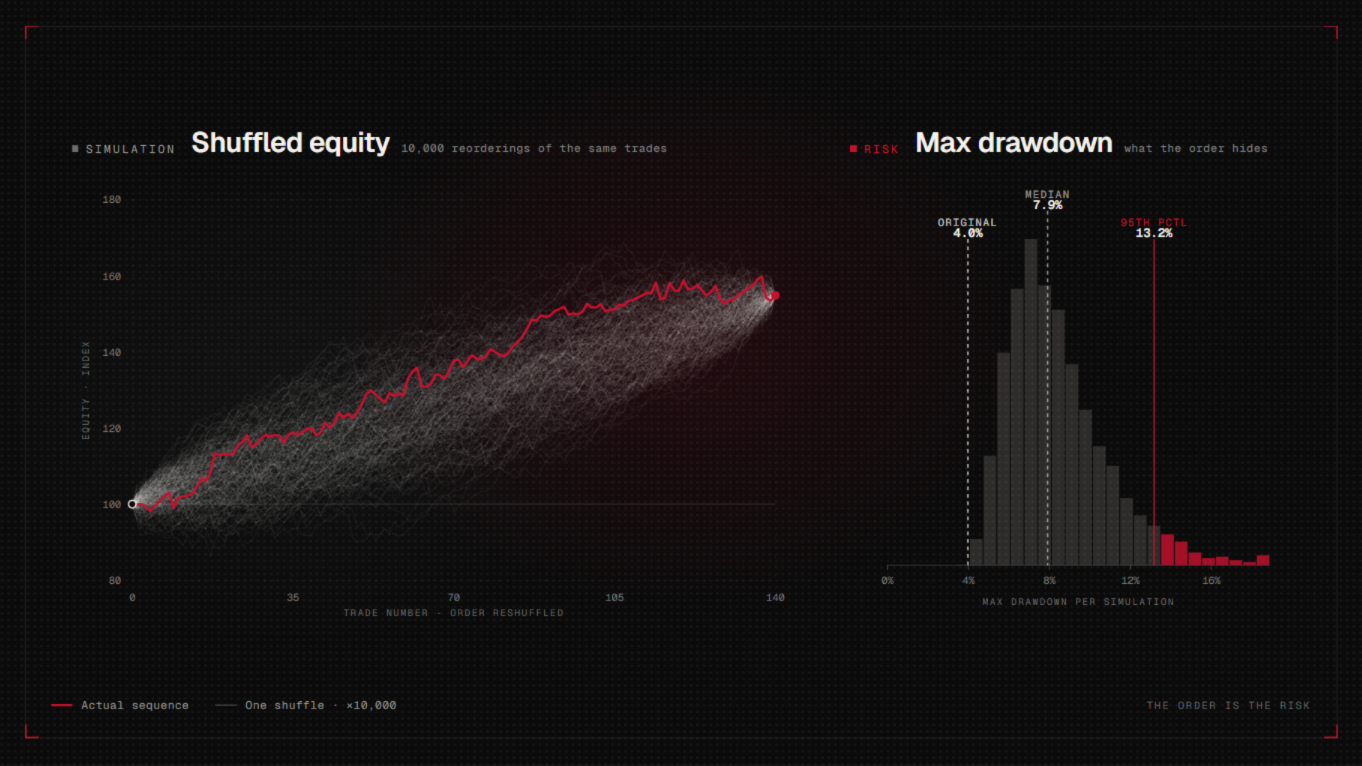
Monte Carlo on the trade sequence tests this. Take the historical list of trade outcomes. Shuffle the order. Reconstruct the equity curve. Repeat ten thousand times. Look at the distribution of maximum drawdowns and the distribution of final returns.
The reporting metrics:
Median maximum drawdown across the simulations.
95th percentile maximum drawdown.
Standard deviation of final equity.
A strategy that holds up under randomisation has a median drawdown close to the original drawdown and a 95th percentile drawdown within twice the original. If the 95th percentile is three times the original, the strategy is fragile to trade order and will likely surprise you live.
This is also where strategies that look too good often fail. A model with an original maximum drawdown of 4 percent might have a 95th percentile drawdown of 12 percent under trade-order randomisation. That is the real risk you are taking. Size the strategy accordingly.
What does a strategy that passes all three look like?
A strategy that passes walk-forward, parameter sensitivity, and Monte Carlo on the trade sequence usually has these properties.
The backtest Sharpe is between 1.0 and 2.0. Above 2.5 in a single-strategy backtest on retail-accessible data is almost always overfit. The exception is short-horizon, high-frequency strategies where the trade count is in the thousands and statistical confidence is genuine.
The maximum drawdown is between 4 and 12 percent of allocated capital. Below 4 percent looks suspicious unless the strategy genuinely caps losses through structural design (small position size, tight hard stops).
The parameter set looks unremarkable. Lookbacks around standard intervals (20, 50, 100 periods rather than 23, 47, 113). Thresholds at round numbers rather than oddly specific decimals. The optimiser has not had to torture the parameters to find performance.
The walk-forward efficiency sits between 60 and 80 percent. Above 80 percent suggests the out-of-sample window is too easy or too short. Below 60 percent suggests the in-sample optimisation is too aggressive.
Most strategies that come out of a brute-force optimisation do not pass all three. That is the point. The filter is harsh because the underlying problem (live trading exposing overfit models) is harsh.
Live-vs-backtest variance
The three checks above are necessary but not sufficient. The only true test of whether a strategy is overfit is to ship it live with enough capital and watch.
The metric that matters: live-vs-backtest variance after the first 100 trades. The expected backtest path projects forward. The live equity curve diverges. The size and shape of the divergence is the test.
A strategy that passed all three checks should run within 15 to 20 percent of the expected backtest path across the first 100 trades. Live results inside that band are within normal sampling variance. Live results outside the band, particularly in the same direction repeatedly, indicate the backtest was misleading and the strategy is decaying or was overfit from the start.
The 100-trade threshold matters. Below it, sample size is too small to draw conclusions.
What I do in practice: every new strategy ships at small capital with a hard cutoff. After a few months of watching live trades, I compare the live equity curve to the projected backtest curve. Strategies that track stay in the portfolio. Strategies that drift get pulled and re-examined.
There is no clever filter that catches everything. There is only the application of the checks, followed by live validation, followed by withdrawal when the validation fails.
Common questions
What is overfitting in trading?
Overfitting is when a trading strategy is tuned so closely to historical data that it captures noise rather than true alpha. The strategy performs well in backtests and fails when faced with new market conditions. It is the single most common reason systematic strategies fail to deliver live what they promised in testing.
How does walk-forward analysis prevent overfitting?
Walk-forward analysis prevents overfitting by separating the data used to optimise the strategy from the data used to test it. Each window optimises on past data and tests on future data the optimiser has not seen. If the strategy performs well in the out-of-sample windows, the parameters generalise rather than memorise.
Is Monte Carlo simulation enough to catch overfitting?
No. Monte Carlo on the trade sequence catches one specific failure mode: trade-order luck. It does not catch in-sample optimisation overfitting or parameter sensitivity overfitting. You need walk-forward and parameter sensitivity checks alongside Monte Carlo, in that order.
How many trades do you need before a backtest is reliable?
A minimum of 200 trades for any meaningful confidence, and 500 or more for higher conviction. Anything below 200 trades is too small a sample to distinguish luck from edge. The trades should span multiple market regimes (trending, ranging, volatile, calm) rather than being clustered in one period.
What is parameter sensitivity in systematic trading?
Parameter sensitivity is how much a strategy's performance changes when the parameters are shifted slightly. A strategy that holds up has low parameter sensitivity: small changes produce small effects on returns. An overfit strategy has high parameter sensitivity: small changes produce large effects, often catastrophic ones.
Where this leaves the practitioner
The three checks are a filter. Strategies that pass all three are more likely to survive live trading than strategies that do not, but the relationship is probabilistic. Markets shift, regimes break, edges decay. The discipline is in the workflow itself.
What the workflow buys you is the right to be honest with yourself. When a strategy fails live after passing all three checks, the failure has a knowable cause: regime change, edge decay, broker execution drift. When a strategy fails live without these checks, the failure could be anything, and the trader has no way to learn from it. That is the difference the workflow makes.
Disclosure. Personal commentary, not financial advice. Capital at risk. I am an employee of Darwinex; content touching Darwinex products may represent a conflict of interest, disclosed per MAR Article 20.
XAQP figures are point-in-time as of June 2026 and will change.
Get the next letter in your inbox.
Please consider subscribing to receive more episodes of The Letter.
Subscribe now