Try to Kill It
Why a pretty equity curve means nothing, and the ruthless framework required to test an algorithmic trading strategy.
- Split your history three ways (a 2-year in-sample, a long walk-forward out-of-sample, and an older block the optimiser never saw) and keep one slice unspent for the final decision.
- Judge candidates on parameter stability and sample size before headline performance. A cliff in the parameter surface shows up live as a blown expectation.
- The historical max drawdown is a floor. Monte Carlo the trade sequence, size to the 95th percentile path, then paper trade for three months before a penny goes live.
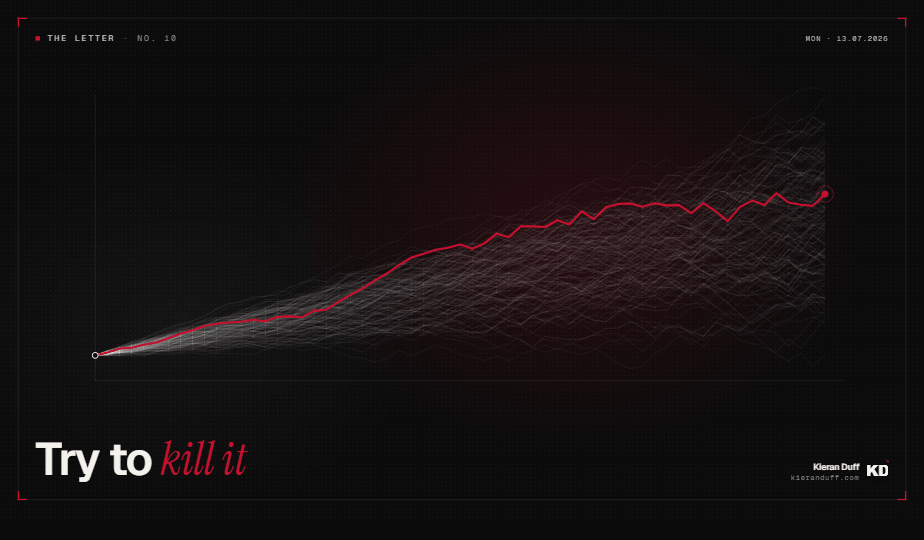
A backtest is one version of history, run once, on settings you chose after seeing the data. Treating it as "proof" is how trading accounts die in real-time. Learning how to test a trading strategy properly means treating that first equity curve as a hypothesis, then spending weeks trying to kill it. I run somewhere between 15 and 30 automated strategies live at any given time, and every one of them survived the same gauntlet: three separate data blocks, parameter stress, Monte Carlo on the trade sequence, a three-month paper-trading gate, and a probation period at reduced size. This is that process, end to end.
What does a proper testing process look like?
It looks like a series of attempts to kill the strategy. Each stage exists to hand the candidate a new way to fail, and the strategies that reach my live book are simply the ones that ran out of ways to die.
The gauntlet has five stages: data splits, parameter stress, Monte Carlo, paper trading, and live probation. The edge comes from running all five with brutally honest thresholds, in order, without skipping the boring ones because the equity curve looks too good to pass.
One stance shapes everything: I optimise for stability, and I'm happy to accept lower headline performance if the strategy brings a much larger trade sample, within reason. Sample size is one of the most important inputs when assessing the robustness of a system. A strategy showing a 1.8 profit factor over 400 trades tells me more than one showing 2.6 over 60. The second number is a rounding error away from luck.
How should you split your data?
Three blocks, and the optimiser only ever sees one of them. My general in-sample period is 2 years (but that's not a rule, find a sample period that you like). That's where any optimisation happens, and even there I do very little of it. Behind that sits a 6-year walk-forward out-of-sample block: data the strategy meets in sequence, exactly as it would have live. And in front of the in-sample, chronologically earlier, sits an 8-year "old" out-of-sample block: market conditions from before the hypothesis was even formed.
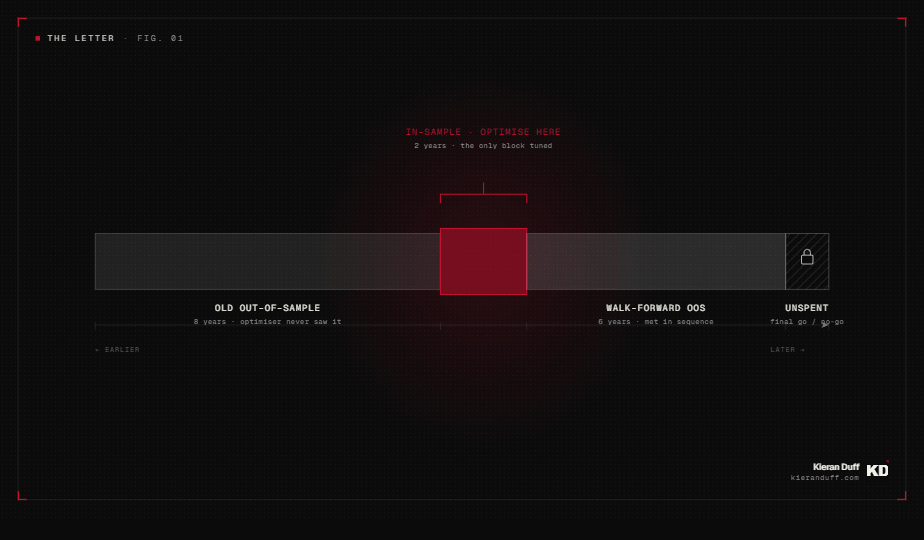
The old block is the one that stings. Plenty of candidates sail through the recent walk-forward because the recent walk-forward looks like the in-sample regime. Then they hit data from eight years back and fall apart, which tells you the "edge" was just a description of one market period.
Two disciplines keep the splits honest. First, count the regimes in your sample, because a thousand trades from one trending year still only tested the settings against one market condition. Second, treat out-of-sample data as a consumable. Every time you look at OOS results and go back to tweak the entry, that block becomes part of your in-sample. After a few passes it has nothing left to tell you. Keep an untouched slice for the final go/no-go and look at it exactly once.
None of this is my invention. The maths of multiple testing is brutal and well documented: run enough backtest variations and a "significant" result is close to guaranteed. Bailey, Borwein, Lopez de Prado and Zhu formalised it as the probability of backtest overfitting, and Lopez de Prado's Pseudo-Mathematics and Financial Charlatanism is the short, angry version. Harvey and Liu argue your backtest Sharpe deserves a haircut for every trial you ran to find it. Read them once and you never trust a single unsplit backtest again.
Why does parameter stability beat headline performance?
Because robust settings sit on plateaus, and curve-fit settings sit on spikes.
Take any parameter that matters (a lookback, an ATR multiple, a session window) and step it through its neighbours. If performance holds across a wide band, the edge is structural. If shifting the lookback from 20 days to 21 drops the equity curve by 30%, then I have bad news my friend.
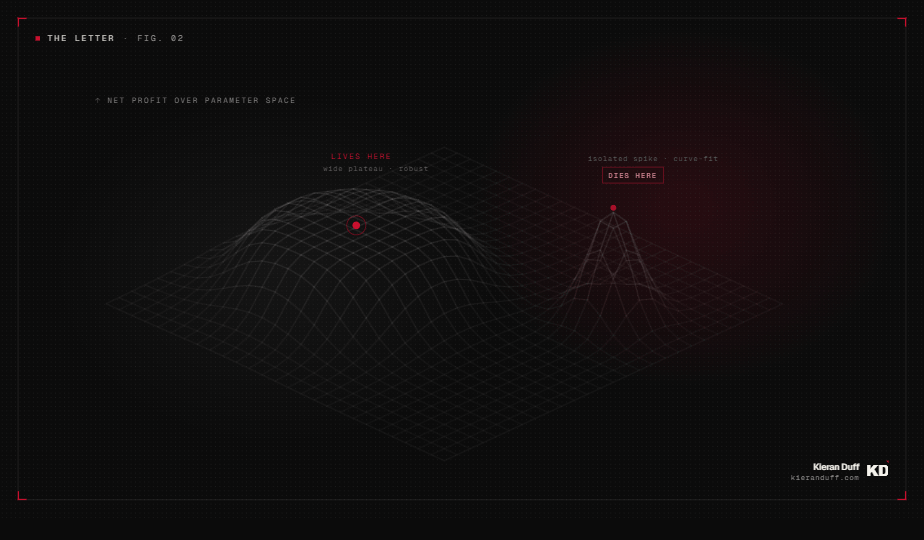
I run this as a perturbation test: jitter each parameter a few percent and re-run. Results that scatter on tiny nudges are a knife-edge fit you will never hold live. Whenever I do optimise, stability is the number one factor, ahead of net profit, every time. The monthly return distribution should look boringly similar across nearby settings.
Two related checks. If you build candidates with a genetic engine, run the search twice with a different random seed; if the "best" strategy changes each run, the engine fitted the sample's noise. And give every parameter a structural reason to exist: an ATR period that matches the holding horizon, a session window that matches real liquidity. A parameter you can explain survives regime change. A parameter the optimiser won gets refit every year.
What does Monte Carlo actually tell you?
It tells you your backtest's worst drawdown is an anecdote. The historical max drawdown is a single sample from a distribution: one ordering of trades that happened to occur. Resample the trade sequence with replacement a few thousand times and you get the distribution that single number came from. The 95th percentile drawdown of those paths is the number I size to. It is always worse than the historical print, and live trading has a habit of agreeing with it.
Treat the backtest drawdown as a floor. Size the strategy so the 95th percentile path is survivable at both layers: the strategy's own budget (each XAQP sub-strategy is designed to a maximum -1% historical drawdown at strategy level) and the portfolio overlay that sits above the sub-strategies. Judge drawdowns on depth and time together; a shallow drawdown that lasts nine months will test you harder than a sharp one that recovers in three weeks.
One technical point that matters: resample the trade sequence, and keep the trades intact while you do it. Shuffling daily returns instead of trades destroys the streak structure, and the streak distribution is exactly the thing you are stressing.
Where do backtests and live results diverge first?
Costs and fills, long before signal decay gets a chance.
The usual killers: a flat spread assumption on a sub-H1 system (a 0.2 pip error compounds across thousands of trades into a materially different strategy), stops and targets given the same fill treatment (a stop is a market order that slips through the level; a take-profit is a resting limit that fills at the price or misses entirely), and overnight financing left unmodelled, including the triple-swap night on FX positions.
Two cheap tests catch most of it. Re-run the backtest on a second broker's data feed; feed differences and bar-construction artefacts flag fragile strategies before live trading flags them expensively. Then rebuild the backtest with pessimistic costs: worst observed spread, slippage on every stop, full swap. If the edge survives the pessimistic run, it has margin. If it needs the optimistic assumptions to stay profitable, the market will make that decision for you.
Why paper trade for three months?
Because the backtest tested the idea, and the paper phase tests everything else.
Every strategy I run goes through a minimum of 3 months on a secondary live account before it touches my main live book, no matter how good the system looks on paper. The rule has no exceptions, and it is the cheapest insurance in the whole process. Paper trading surfaces the failure modes a backtest cannot see: the data feed that freezes on a news print, the VPS restart that orphans a position, the order refused in the half-second your code never planned for, the signal that fires on a bar your backtest engine constructed differently.
It also gives you your first genuinely out-of-sample trades in the only regime you can never test in advance: the one happening now. Three months is short enough to keep the pipeline moving and long enough for the strategy to meet conditions the build never chose.
And it tests the operator. Watching a new system take its first losses with no money attached teaches you whether you can follow its rules when money is attached. (Believe me, I've been there.)
What do the first 100 live trades tell you?
Whether the thing you tested is the thing you're running.
New strategies enter my book at a fraction of target size and earn their way up as the live sample grows. The question during probation is narrow: does live behaviour match backtest behaviour? Compare fill quality, average trade, win rate and trade frequency against expectation. Some variance is normal. Drift that widens as the sample grows is the tell that something structural (costs, fills, data) differs from the test.
Watch signal health before the equity curve. Live-vs-backtest variance, win-rate drift and average-trade decay all degrade before the drawdown confirms it. A drawdown-based kill switch fires late; the health metrics fire early. Write the retirement rules before go-live, while you're still objective about the strategy. A candidate admitted on evidence should only die on evidence.
Build time is sunk. Judge the live candidate against the same bar as every other candidate, however many weekends it cost you.
Common questions
How much historical data do you need to test a trading strategy?
Enough to cover several distinct market regimes. My own splits total 16 years across three blocks. Calendar length alone can mislead: count the regimes the sample actually holds, because a thousand trades from one trending year still only tested one condition.
Is demo trading the same as backtesting?
They do different jobs. The backtest measures the edge across history; the demo (paper) phase measures execution, data feed, infrastructure and your own behaviour against the live market. A strategy needs to pass both, in that order. Disclaimer: I personally don't use "demo" accounts, I use accounts that hit the live market to test live conditions.
How many trades make a valid sample?
It scales with win rate and payoff. A flat 100-trade rule under-powers a low-win-rate, high-reward strategy, which needs far more trades for its expectancy to separate from noise. I'm happy to take lower headline performance for a much larger sample, within reason.
When is a trading strategy ready to go live?
When it has survived every data block, holds performance on nearby parameter settings, passes Monte Carlo sizing at the 95th percentile, and completes a minimum of three months on paper. Then it starts live at a fraction of target size and earns its way up.
The bar a strategy has to clear
The pattern behind every stage is the same: make the strategy prove itself on evidence it wasn't built from. Data it never saw. Settings it wasn't tuned to. Trade orderings that never happened, and finally a live market with real fills. A strategy that clears all of that has earned a small slot in the book and the chance to grow it. Every candidate that fails along the way just saved you its live drawdown. That's the return on all this admin.
Personal commentary, not advice. Capital at risk.
Disclosure. Personal commentary, not financial advice. Capital at risk. I am an employee of Darwinex; content touching Darwinex products may represent a conflict of interest, disclosed per MAR Article 20.
XAQP figures are point-in-time as of June 2026 and will change.
Get the next letter in your inbox.
Please consider subscribing to receive more episodes of The Letter.
Subscribe now