Correlation Isn't Enough
Why a brilliant standalone backtest can make your book worse, and how to evaluate strategies at the portfolio level.
- A strategy earns a slot by improving the portfolio's return against drawdown, after costs, without deepening the drawdowns you already have.
- The backtest correlation matrix is a first screen. Position overlap, correlation drift and drawdown clustering are the checks that actually decide.
- Measure marginal contribution directly: run the book with and without the candidate, and compare the portfolio-level numbers. If the candidate only improves its own equity curve, it hasn't earned anything.

A question hit me on X this week: "could you write about how portfolio creation is actually done? I have strategies I want to combine, but I don't know what to look at beyond correlation and drawdown". And is the correlation matrix in StrategyQuant's analyzer enough? Building a multi-strategy trading portfolio is where I spend most of my working hours, so this one deserves a proper answer. The short version: the correlation matrix is your first screen. The decision gets made by three checks that come after it.
What does "earning a place" in a multi-strategy portfolio actually mean?
A strategy earns its place by making the portfolio better, measured at the portfolio level. That sounds obvious written down, but it changes the whole evaluation. You stop asking "is this a good strategy?" and start asking "what does the book look like with this strategy in it?"
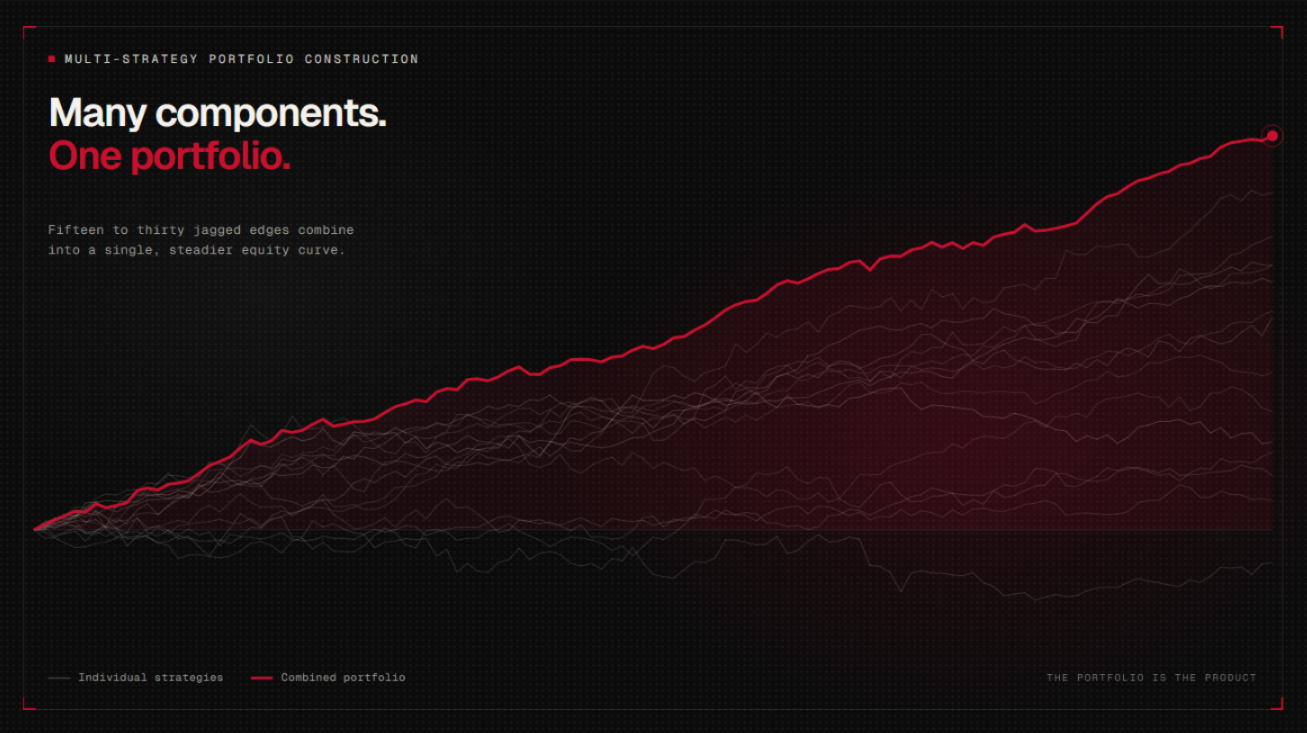
I run somewhere between 15 and 30 strategies on XAQP at any given time, and every one of them had to clear the same test: combine the candidate with the existing book and compare the combined result against the book alone. Return against drawdown. Consistency of the monthly distribution. Depth and length of the worst stretches. If those numbers improve, the candidate is adding something the book doesn't already have. If they stay flat, the candidate is a passenger. A brilliant standalone equity curve that duplicates risk you already hold makes the portfolio worse, because it concentrates the exact drawdown you were trying to diversify away.
That's the mindset shift. The portfolio is the product, and every strategy is a component of it. Institutional multi-strategy allocators evaluate components exactly this way (Man Group has a good piece on multi-strategy construction if you want the institutional-scale version), and the logic holds at retail scale too.
Is the correlation matrix in StrategyQuant enough?
It's a legitimate first screen, and I'd keep using it if you're an SQX user. It gets you maybe a third of the way to a decision. The matrix in StrategyQuantX (I only built a few of my candidates there) is measuring one thing: the correlation of backtest returns between strategies over one historical window. That number carries three blind spots you have to cover separately.
First, it's built on returns, so two strategies can score as "uncorrelated" while holding positions at the same time in related instruments. Second, it's an average over the whole test window, and correlations move. Third, it says nothing about costs: margin, financing, and execution drag all stack when strategies fire together, and no correlation matrix will show you that.
Use the matrix to kill the obvious duplicates early (anything scoring high against an existing strategy goes straight back in the pile). Then move to the checks below for anything that survives.
Why isn't returns correlation the whole story?
Because the correlation of strategy returns and the correlation of open positions are two different numbers, and portfolio risk lives in the second one.
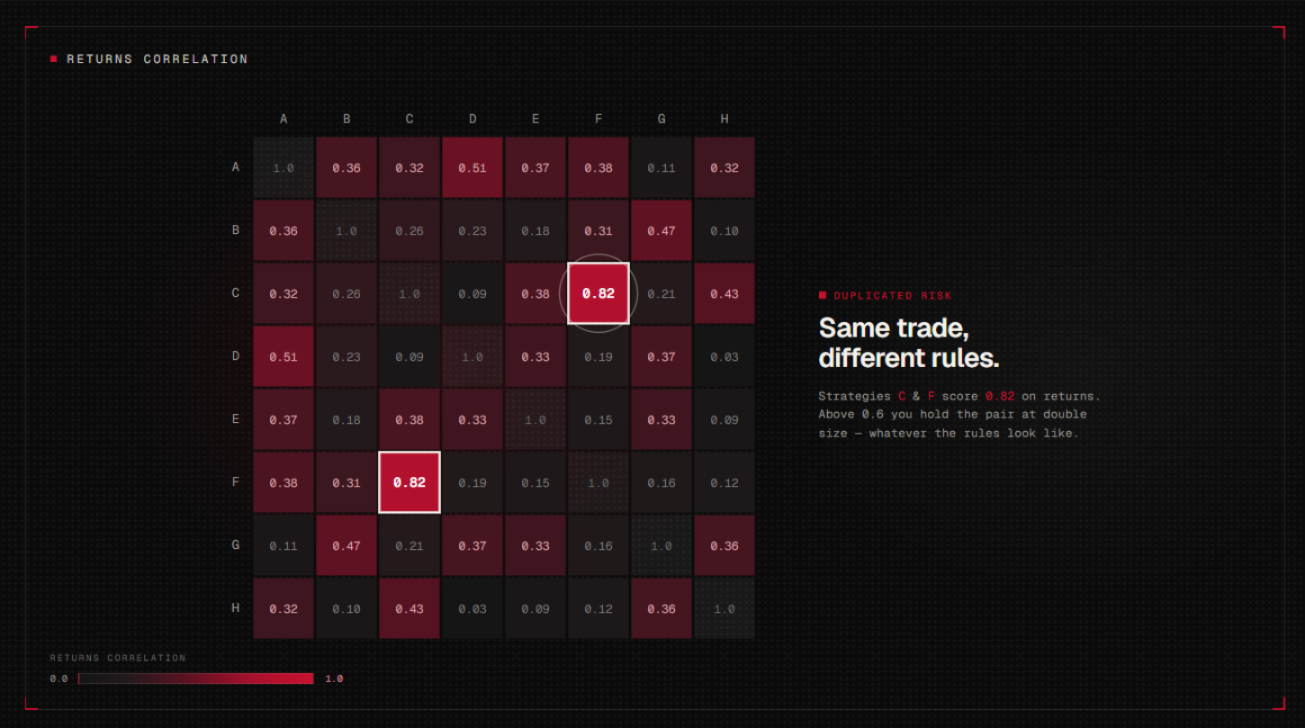
Returns correlation is computed from each strategy's equity changes, usually daily or per-trade. Two strategies can have low returns correlation across a 6-year backtest and still end up long risk in the same session, on correlated pairs, during the exact week it matters. Different logic can fire on the same bars. I see this constantly with genetically evolved strategy sets: the rules look completely different, the returns correlation looks acceptable, and then you build a trade-overlap matrix and find they're the same trade wearing different rules.
The fix is mechanical. Take the trade lists from both backtests and measure how often the strategies hold positions simultaneously, in which instruments, and in which direction. If two strategies are in the market together far more often than chance suggests, treat them as one strategy for risk purposes, whatever the returns matrix says. As a rough working band: a returns correlation above 0.6 is duplicated risk, and anything in the 0.35 to 0.6 zone is a prompt to run the position-overlap check before you trust it.
What happens to strategy correlations under stress?
They rise, and they rise most in exactly the conditions you built the diversification for. A correlation measured once at build time is an estimate from calm data, because calm data is most of the sample. When volatility spikes, instruments that normally wander independently start moving together, and strategies that trade them follow.
This is a well-documented effect in markets generally: Longin and Solnik's study of extreme correlation in the Journal of Finance found that cross-market correlation rises sharply in falling markets, precisely where a diversified book needs it to stay low. The same behaviour applies with full force to a retail-scale systematic book. The practical response: measure correlations on a rolling window, and look specifically at what your strategy pairs did during the worst 5% of days in the sample. The correlation during the stress weeks is the number your drawdown will be built from. The full-sample average is trivia.
If a candidate strategy is uncorrelated in calm conditions and converges with your book in stress, it fails the audition. That's the regime where you needed it to be different.
How do you measure drawdown overlap?
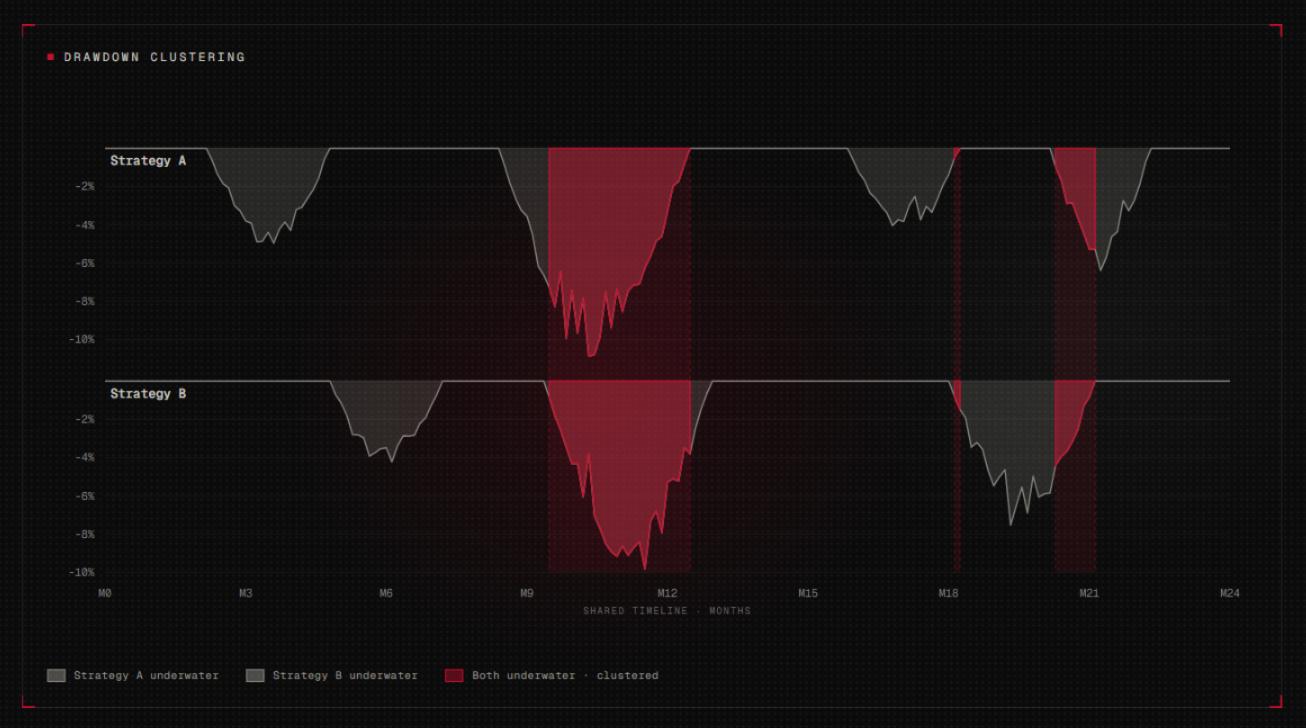
Line up the drawdown periods of every strategy and check how much they coincide, because a portfolio's real max drawdown is driven by clustering. If your strategies concentrate their losing stretches in the same sessions or the same weeks, the portfolio drawdown in the backtest is optimistic by construction, and the live version will find the deeper number for you.
Two checks I run on every candidate:
The overlap distribution. For each historical drawdown in the existing book, what was the candidate doing? A candidate that was flat or recovering through the book's worst stretches is worth far more than its standalone Sharpe suggests. A candidate that was underwater at the same time adds depth to your worst weeks.
Monte Carlo on the combined trade sequence. A backtest max drawdown is a single sample from a distribution. Reshuffle the combined trade sequence a few thousand times and look at the 95th percentile drawdown path. I size to that number on XAQP, and it is reliably worse than the historical figure. (Believe me, sizing to the historical number is how you end up making promises your book can't keep.)
Depth and time both matter here. A drawdown that recovers in two weeks and a drawdown of the same depth that grinds for four months are different animals, and the second one is the one that breaks a systematic traders' discipline.
What else does a new strategy cost the book?
Margin, financing, and execution drag, and every one of them stacks in the busy moments. A live account has a hard margin ceiling. Add a strategy that likes the same sessions as your existing book and the busy days get busier: several strategies firing at once means the last entries get clipped for margin exactly when the book is most active. The backtest, running each strategy in isolation with unlimited headroom, has no idea.
Financing stacks the same way. Every additional overnight position pays swap, and a strategy that holds through Wednesday nights in FX pays three days of financing at once. An edge worth a few percent a year does not survive that unless the holding profile was designed around it. Execution drag rises with trade count on top.
None of this shows up in a correlation matrix, and all of it lands on the same portfolio-level return-against-drawdown number you're trying to improve. A candidate that clears every statistical check but pushes the book's cost drag up faster than its edge contribution has still failed the audition.
How I run this on XAQP
My own funnel, so you can see the shape of a working process. Candidates come out of StrategyQuantX and my own build pipeline. Each one gets optimised on a deliberately small in-sample window (my general in-sample period is 2 years), then validated on a 6-year out-of-sample walk-forward, plus an 8-year "old" out-of-sample on data from before the in-sample window. I do very little optimisation, and when I do, stability is the number one factor: parameter plateaus and a consistent monthly distribution beat headline profit every time.
Survivors go through the portfolio checks above: returns correlation as the first screen, then trade overlap, rolling and stress correlation, drawdown clustering, and the margin and cost stack. Anything that still looks additive trades on paper for at least 3 months before it touches the live book, no matter how good it looks. At the risk layer, every sub-strategy is designed to a maximum historical drawdown of -X% at sub-strategy level, with separate risk overlays at the portfolio level. Two layers, on purpose: the sub-strategy rule caps what any single component can do to the book, and the portfolio overlay catches what the components do together.
That structure is what has kept XAQP's live max drawdown at -5.83% against a +46.74% return since inception in April 2025 (figures as of 6th July 2026; past performance is not indicative of future results, capital at risk). The full track record is public on Darwinex if you want to inspect it. The process that produced those figures is the bit you can copy.
Common questions
Is a correlation matrix enough to build a portfolio?
It's enough to reject candidates, and that's genuinely useful. High correlation against an existing strategy is a fast, reliable kill signal. For everything the matrix passes, you still need position overlap, stress behaviour and drawdown clustering before the candidate deserves capital.
What correlation is too high between trading strategies?
Above 0.6 on returns, treat the pair as one strategy holding double size. Between roughly 0.35 and 0.6, run the trade-overlap check and look at stress-period behaviour before trusting it. Below that, the returns number is fine as a screen, and the other checks still apply.
How many strategies do you need for a diversified portfolio?
There's no magic number, and independence matters far more than count. Ten strategies correlated through one hidden factor are one trade with extra admin. I run between 15 and 30 on XAQP, and the count moves as strategies earn slots or get retired.
Should every strategy get the same weight?
Weight by risk contribution to the portfolio. Equal capital weights hand your biggest allocation to your most volatile component. Size each strategy so its contribution to portfolio drawdown stays inside your design limit, and let the boring, steady components carry more capital than the exciting ones.
Do I need different instruments to diversify, or different logic?
Either can do it, and neither guarantees it. Two logic families on the same instrument can be genuinely independent; two instruments driven by the same macro factor can be one trade in two wrappers. The check is behavioural: measure the trade overlap and the stress-period correlation, and let those numbers tell you whether the diversification is real.
The bar a strategy has to clear
Put the candidate in the book and measure three things. The portfolio's return against drawdown improves. The drawdown overlap doesn't deepen the worst stretches. The cost stack doesn't eat the improvement. Clear all three and the strategy has earned its slot. Miss any one and it goes back into the pipeline for more paper trading and another look next month. (Plenty of mine never make it out, and that's the system working.)
The correlation matrix that prompted this question sits inside the first of those three checks. Keep it. Then build the rest of the process around it, because the matrix screens components, and a multi-strategy trading portfolio is judged at the portfolio level.
Personal commentary, not advice. Capital at risk.
Disclosure. Personal commentary, not financial advice. Capital at risk. I am an employee of Darwinex; content touching Darwinex products may represent a conflict of interest, disclosed per MAR Article 20.
XAQP figures are point-in-time as of 6 July 2026 and will change.
Get the next letter in your inbox.
Please consider subscribing to receive more episodes of The Letter.
Subscribe now